Guide
Table of contents
Prerequisites
Get a Lightstep Account
Lightstep is the leading Open Telemetry platform that natively, naturally, and scalably combines metrics and tracing. Query and investigate issues and automatically correlate root causes across Traces, Metrics, and Logs anywhere in the system. You will need a Lightstep account to collect Telemetry from your servics. Procedure is as follows:
-
You probably allready have a Lightstep Account, or you can register for one as follows:
- Browse to the Lightstep App and
Create a Free Account.
- Browse to the Lightstep App and
Instrument Code
Get Lightstep Access Token
-
Browse to Lightstep App
-
Select your Project (e.g. dev, prod, or other)
-
Navigate to Settings > Access Tokens
-
Safeguard your
Access Token
Create Lightstep configmap
-
Start a Bash Shell
-
Configure kubectl environment variable
export KUBECONFIG=$HOME/.kube/config-aks -
Set kubectl context for AKS (See Example below)
kubectl config use-context olympus -
Test AKS Cluster Connection
 kubectl cluster-info
 kubectl get nodes -A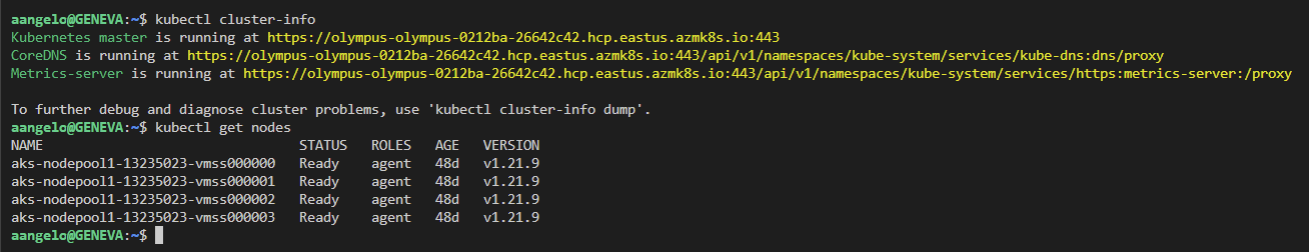
-
Set Lightstep Access Token Environment Variable
export LS_ACCESS_TOKEN=YOUR LIGHTSTEP ACCESS TOKEN -
Create Lightstep configmap
 kubectl apply -n cassandra -f - <<EOF
 kind: ConfigMap
 apiVersion: v1
 metadata:
   name: lightstep-configmap
 data:
   collector-config: |
     receivers:
       otlp:
         protocols:
           grpc:
           http:
     exporters:
       otlp:
         endpoint: ingest.lightstep.com:443
         headers:
           "lightstep-access-token": "${LS_ACCESS_TOKEN}"
       logging:
         loglevel: debug
     service:
       pipelines:
         traces:
           receivers: [otlp]
           processors: []
           exporters: [logging,otlp]
 EOF
Enable Instrumentation
-
Sign In to GitHub
-
Select the Boutique Project (e.g.
cassandra) you configured earlier. -
Locate the
helm/templates/kubernetes-manifests.yamlfile -
Un-Comment the Deployment section for the
otelcollector -
Un-Comment the
imagesection as follows:image: otel/opentelemetry-collector-contrib:0.49.0 # image: ghcr.io/lightstep/lightstep-partner-toolkit-collector:latest -
Un-Comment the Service section for the
otelcollector -
Un-Comment the
#Lightstep Instrumentationsections for all the services to expose theOTEL_EXPORTER_OTLP_TRACES_ENDPOINTandOTEL_RESOURCE_ATTRIBUTESto Lightstep as follows:# Lightstep Instrumentation - name: OTEL_EXPORTER_OTLP_TRACES_ENDPOINT value: "http://otelcollector:4317" - name: OTEL_RESOURCE_ATTRIBUTES value: "service.name=productcatalogservice,service.version=1.0.0" -
Commit changes
Deploy Instrumented Application
Re-Deploy Application using Helm Pipeline
After the Lightstep instrumentation, we need to re-deploy the 10 Boutique application Pods along with the new Lightstep OTEL collector Pod to your Azure Kubernetes using the same provided kubernetes-deploy-all Helm Pipeline. Procedure is as follows:
-
Sign In to Azure DevOps
-
Select the Boutique Project (e.g.
cassandra) you configured earlier. -
Navigate to
Pipelines > All > azure-pipelines -
Select the
kubernetes-deploy-allPipeline -
Press
Run Pipeline -
Review Variables and press
Runas follows:Name Value Keep this value secret Let users override this value when running this pipeline SERVICE_NAMESPACE cassandraFalse True REPO_PREFIX YOUR DOCKER HUB ID False True -
Press
Run -
Monitor the Pipeline and make sure it runs successfully
Monitor Services
-
Browse to Lightstep App
-
Select your Project (e.g. dev, prod, or other)
-
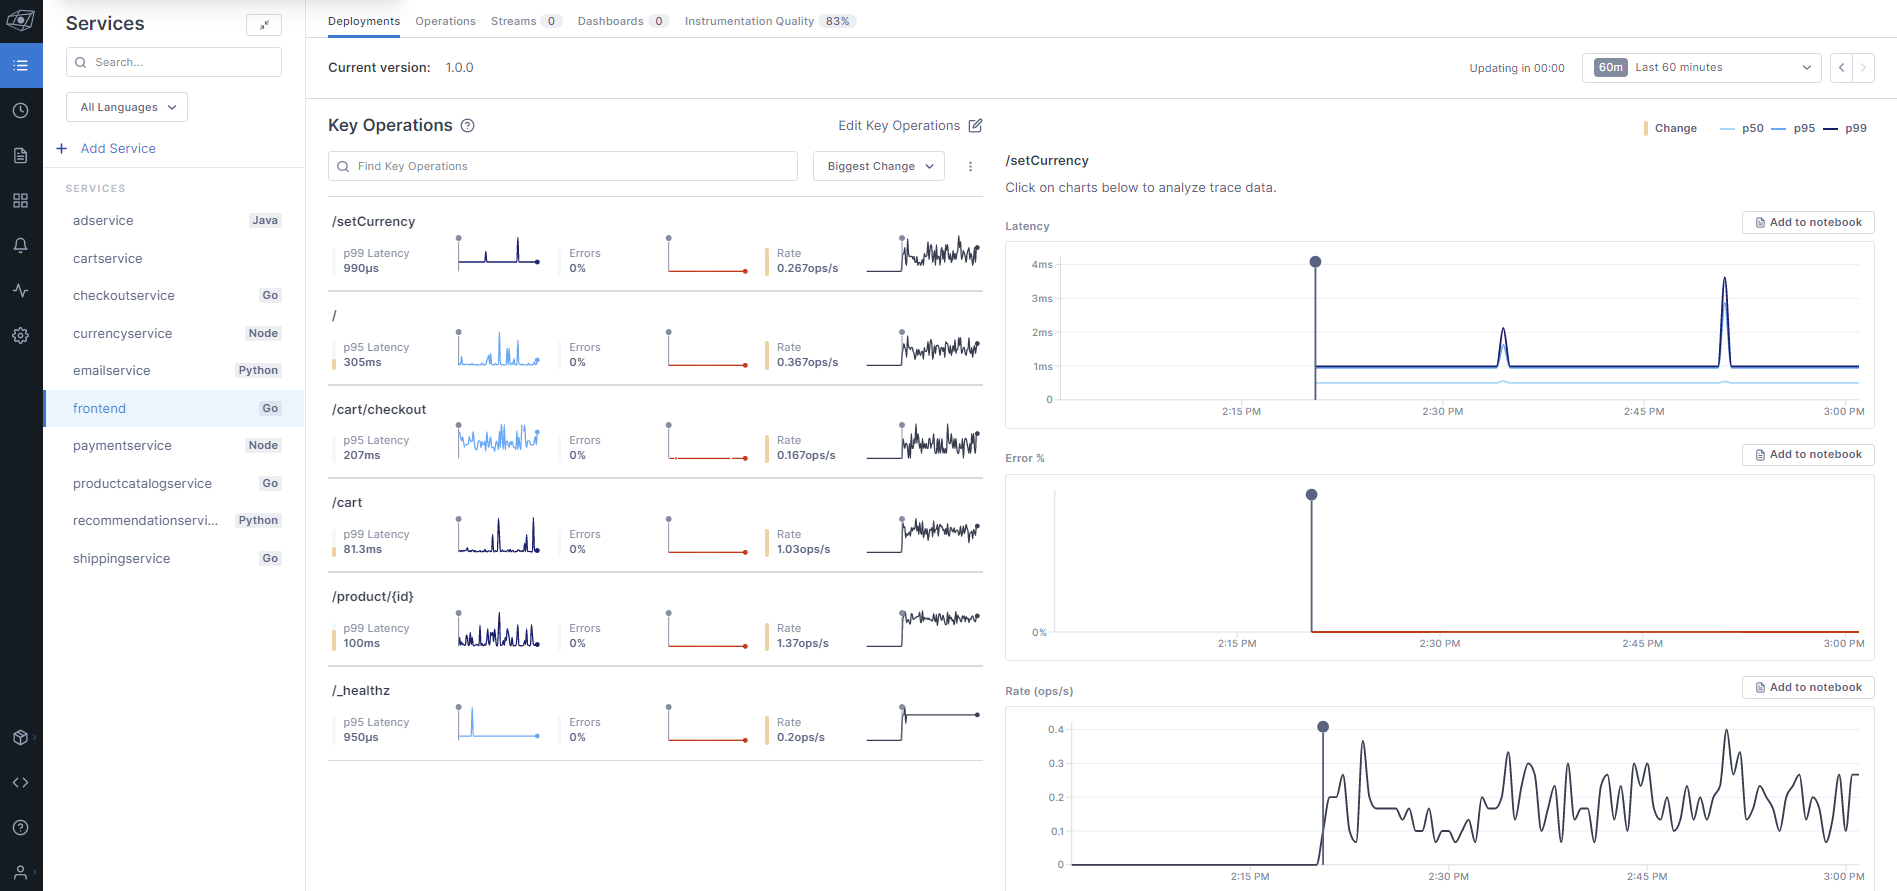
Navigate to the Service Directory, and you should see all 10 services emitting traces
-
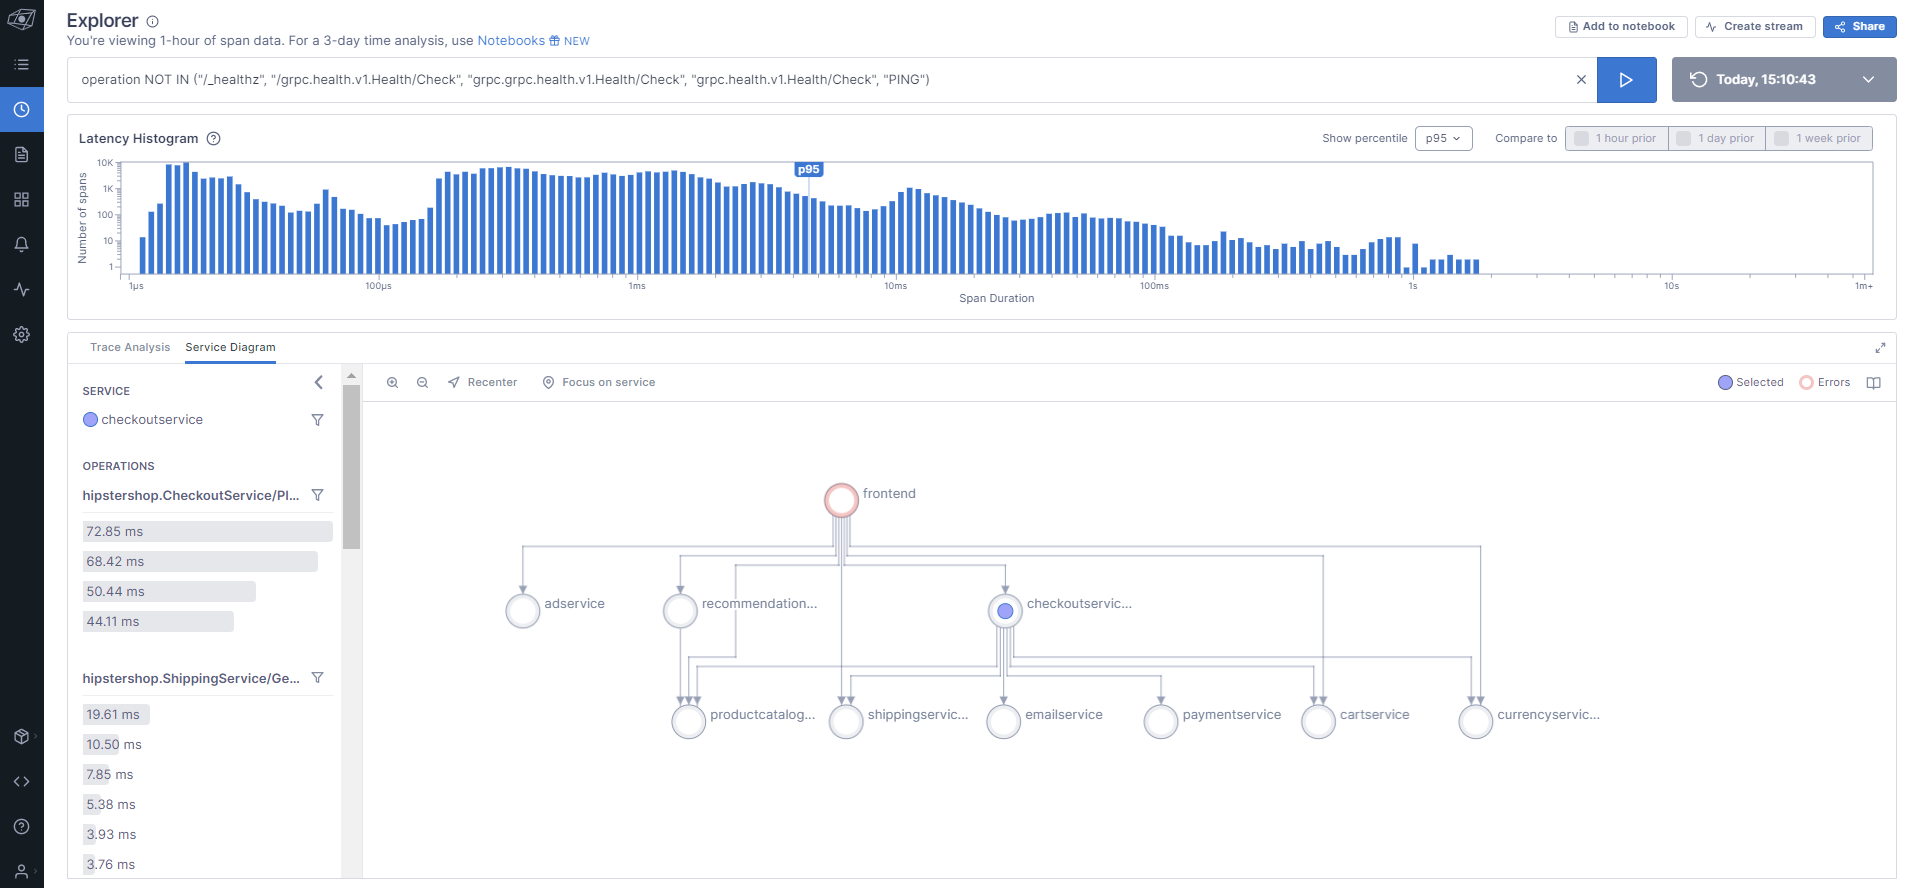
Navigate the Explorer and query for non-health check operations, and sort by descending Duration as follows:
operation NOT IN ("/_healthz", "/grpc.health.v1.Health/Check", "grpc.grpc.health.v1.Health/Check", "grpc.health.v1.Health/Check", "PING")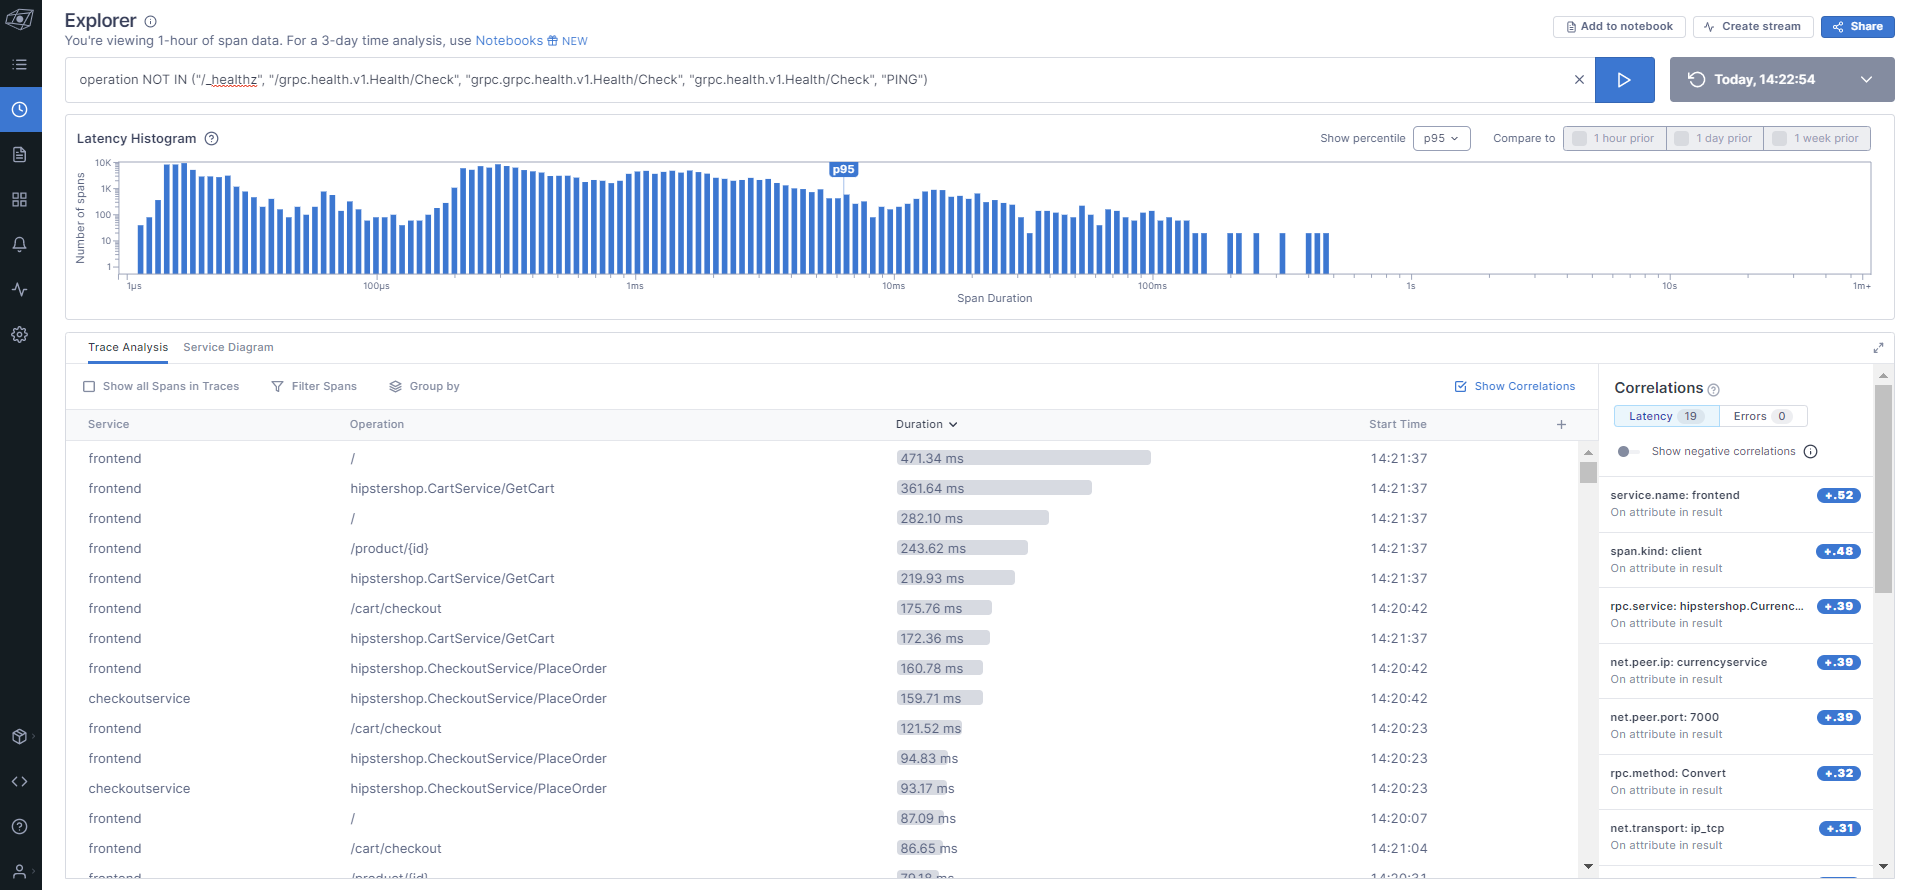
-
Click on one of the longer span durations to examine where the transaction is spending the most time as follows:
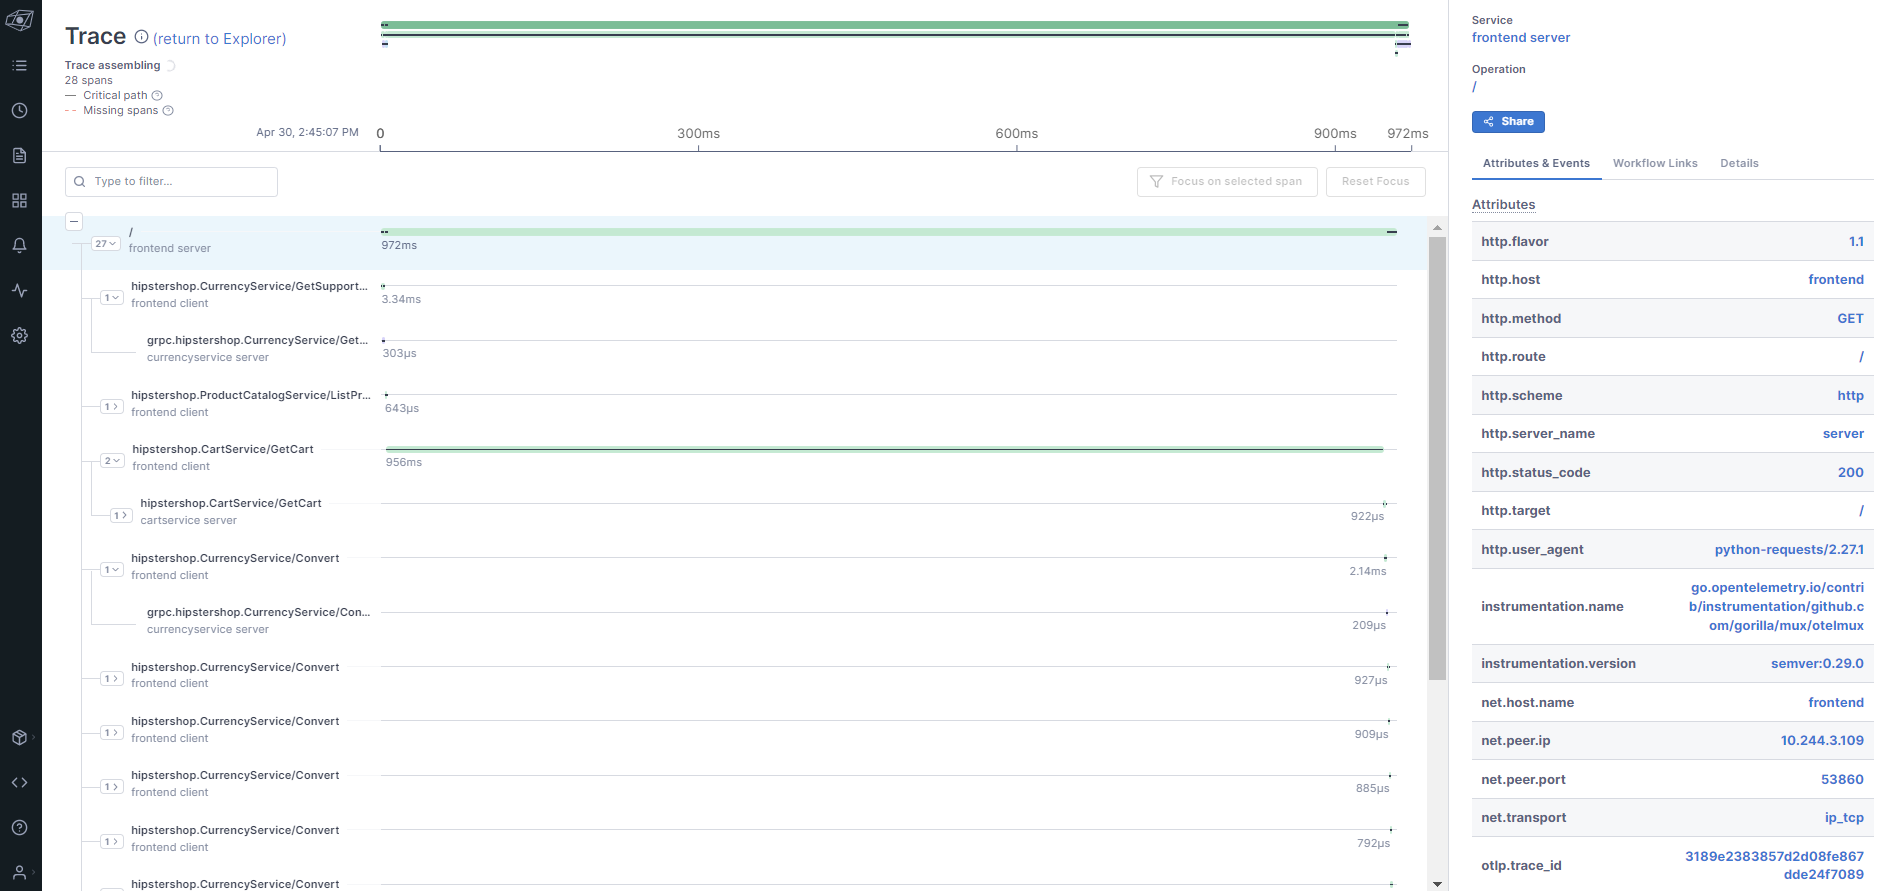
-
Navigate back to the Explorer and examine the live Service Diagram detected by Lightstep from the Traces as follows: